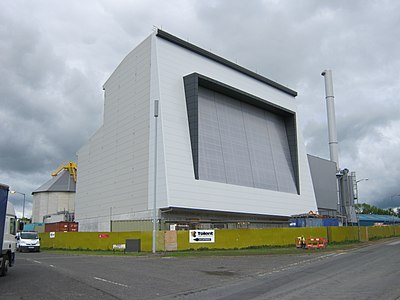
Chilton Power Station
A Biomass Waste EFW facility Chilton Power Station utilises a feedstock of up to 120,000 tpa of Wood Waste to generate 17.5 MWe to be exported to the national grid. The facility is located in the town of Chilton in Durham.
| Chilton Power Station Operational | |
 See Biomass EfW → page for a larger UK Wide map. | |
| Operator | Veolia Bio Energy UK Ltd |
| Capacity | 17.45 MWe |
| Feedstock | Waste Wood |
| EPR (Waste Licence) | BP3736HA |
| ROC | Yes |
| CfD | |
| CHP | No |
Operators Annual Report
Input Data
| Year | Wood | Litter | RDF | Other | Total |
|---|---|---|---|---|---|
| 2017 | 103325 | 0 | 0 | 0 | 103325 |
| 2018 | 117413 | 0 | 0 | 0 | 117413 |
| 2019 | 116234 | 0 | 0 | 0 | 116234 |
| 2020 | 106451 | 0 | 0 | 0 | 106451 |
| 2021 | 108601 | 0 | 0 | 0 | 108601 |
| 2022 | 108160 | 0 | 0 | 0 | 108160 |
Output Data
| Year | IBA | IBA %ge of Tot IN | APC | APC %ge of Tot IN |
|---|---|---|---|---|
| 2017 | 4644 | 4.49% | 1574 | 1.52% |
| 2018 | 6444 | 5.49% | 1476 | 1.26% |
| 2019 | 5102 | 4.39% | 1311 | 1.13% |
| 2020 | 4064 | 3.82% | 1267 | 1.19% |
| 2021 | 4019 | 3.70% | 1351 | 1.24% |
| 2022 | 4021 | 3.72% | 1512 | 1.40% |

Summary
A Biomass Waste EFW facility Chilton Power Station utilises a feedstock of up to 120,000 tpa of Wood Waste to generate 17.5 MWe to be exported to the national grid. The facility is located in the town of Chilton in Durham.
The facility has been developed, built and continues to be operated by Veolia Bio Energy Ltd, previously known as Dalkia Bio Energy Ltd. Construction started in early 2010 and it became operational in 2011[2].
Plant
The facility cost £40 million to develop[2]. It has a design capacity of 14 tonnes per hour with a maximum annual consumption of 120,000 tonnes. This is at a continuous rating of 312 tonnes per day based on an average CV of 15 MJ/kg. The anticipated availability of 7,800 to 8,000 hours per annum (89%)[3].
Annual Sustainability Tonnage Input/Fuel
The tonnage[4] received by the plant in the most recent Annual Sustainability Report and for the previous 3 years for 2020/21 was reported by Ofgem as below[5]:
| Year | Waste Wood (m3) | Waste Wood (t) | Straw | Miscanthus | Arboricultrual Waste | Sawmill Residue | Foresrty Residue | Round Wood | Short Rotation Coppice | MBM | Other Material |
|---|---|---|---|---|---|---|---|---|---|---|---|
| 2020/21 | 0 | 111008 | 0 | 0 | 0 | 0 | 0 | 0 | 0 | 0 | 0 |
| 2019/20 | 0 | 110330 | 0 | 0 | 0 | 0 | 0 | 0 | 0 | 0 | 0 |
| 2018/19 | 0 | 115099 | 0 | 0 | 0 | 0 | 0 | 0 | 0 | 0 | 0 |
| 2017/18 | 0 | 0 | 0 | 0 | 0 | 0 | 0 | 0 | 0 | 0 | 0 |
Waste Tonnage, By Origin
The table shows a list of the Waste for the Permit BP3736HA, that has arrived into sites as reported to the Regulator and then publicised in their reported statistics. The Data used is from the most recent returns. The total reported tonnage arriving at the site was: Expression error: Unexpected < operator.t. Where this tonnage exceeds that reported in year of the corresponding annual report, this may be due to the following reasons:
- Tonnage may have been received but not incinerated, i.e. the material is held pending incineration (the operator return to the EA reports as received whereas the annual report focuses on when the waste is incinerated.)
- Material may have been received into the site but treated in some other way than incineration.
- Material may have been received on the but transferred out of site for disposal/treatment at another site rather than incineration on the site.
| EWC Code | Origin of Waste | Tonnes In |
|---|
The Wood Waste is received from a variety of sources including old pallets, manufacturing off-cuts, wood from the construction and demolition industry and material from Waste Disposal Authority's civic amenity sites[2].
References
- ↑ Robinson, P., 2011. Chilton Biomass Energy Centre County Durham. Online. Geograph.org.uk. [Accessed 7 April 2020.]
- ↑ 2.0 2.1 2.2 Lets Recycle, 2011. Dalkias 40M Biomass Plant Nears Completion - Letsrecycle.Com. Online. letsrecycle.com.[Accessed 6 April 2020.]
- ↑ Annual Performance Report 2021
- ↑ In the case of EfW plants with gasification technology the figures are reported in terms of cubic metres of syngas produced rather than tonnes used
- ↑ Biomass Sustainability Dataset 2020-21
